Part of the challenge or working in a field like Growth Marketing is that there is often a lot of focus on customer acquisition (and for good reason), but some of the more nuanced aspects of growth get a lot less coverage in blogs and other public forums. One of those topics is around retention – specifically, Net Revenue Retention (NRR) and Gross Revenue Retention (GRR).
If these are not already two of your favorite metrics, I hope that by the end of this post they will be!
Why?
Because these two growth metrics are two of the most important ones you can measure, as understanding how they work and what the impact of both have on your startup will help you truly understand the relative strength of your business.
I’ll attempt to outline each concept using some examples below.
NRR – Net Revenue Retention
NRR is total revenue minus churn plus revenue expansion (and also factors in lost revenue from downgrades). Put differently, it’s the percentage of recurring revenue from customers who came in during a cohort and is measured over time.
It’s looked at annually in most cases, though tracked on an annual monthly basis. Think January 2019 against January 2020 or March 2019 against March 2020. This gives you a full year of data to look at to compare.
Here’s an example below of two different month to month annual views of NRR.
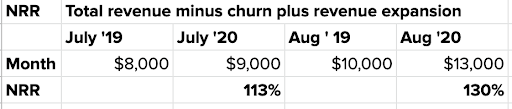
In this example you can see that in July 2019 we had $8,000 in revenue and in July 2020 – one year later – we had $9000 of revenue from that same cohort of buyers who bought in July 2019.
Notes:
- The Aug ‘19 to Aug ‘20 increase came from upsells on this cohort over the year
- August had more upsells compared to July year over year.
- Because of this, the August to August interval was stronger from an NRR perspective.
Why is this important?
“NRR is perhaps the most fundamental KPI in terms of determining customer success with your product. If you’re a highly successful company with happy customers, your NRR will most likely exceed 100%. If you’re closer to 0%, it’s time to start taking a serious look at where your customers are churning out and take evasive action.” – Source: Lighter Capital
To break this down more – if you sign up 10 customers at $1000 each and they all come back 1 year later and are renewing for the exact same price each, you’d have 100% NRR. If you had 10 customers at $1000 each and they all come back 1 year later but 1 of them renews at 2x the cost, you’d have 110% NRR.
NRR benchmarks
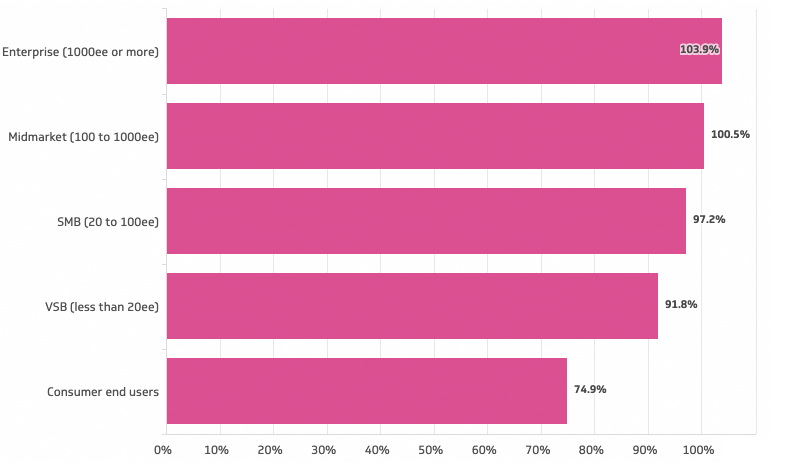
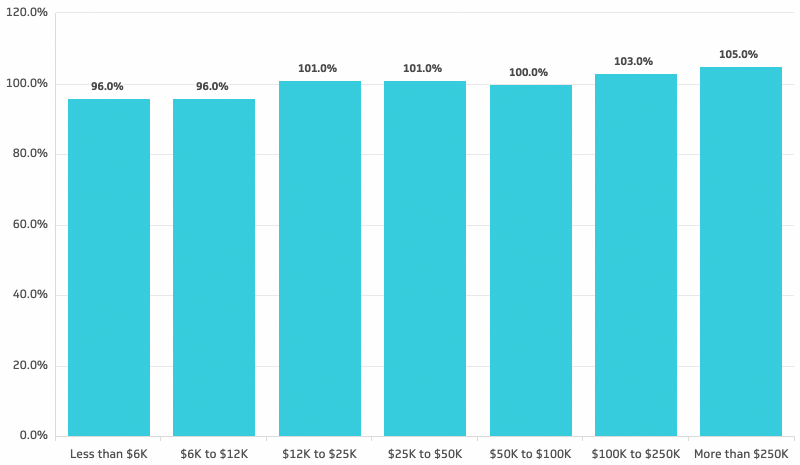
According to an article by Klipfolio, here are a few benchmarks:
Annual Net Revenue Retention by ARPA
Annual Net Revenue Retention by ACV
GRR – Gross Revenue Retention
GRR is total revenue not including expansion. GRR is also looked at annually in most cases, though tracked on an annual monthly basis. Think January 2019 against January 2020 or March 2019 against March 2020. This also gives you a full year of data to look at to compare.
Notes on GRR:
- It’s a range between 0-100%
- Higher % means better core retention
- Low GRR if NRR is high means high upsell but high churn
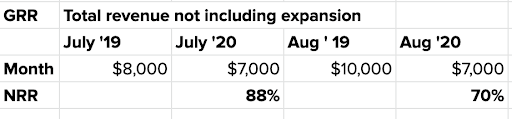
Each year view of the month shows a decrease – 12% and 30% of revenue from these cohorts was lost if you take out upsells. August was worse than July.
So if you did an amazing job of upselling 1 or 2 customers, but a handful of other customers left, you’d not count that upsell revenue in your GRR metric.
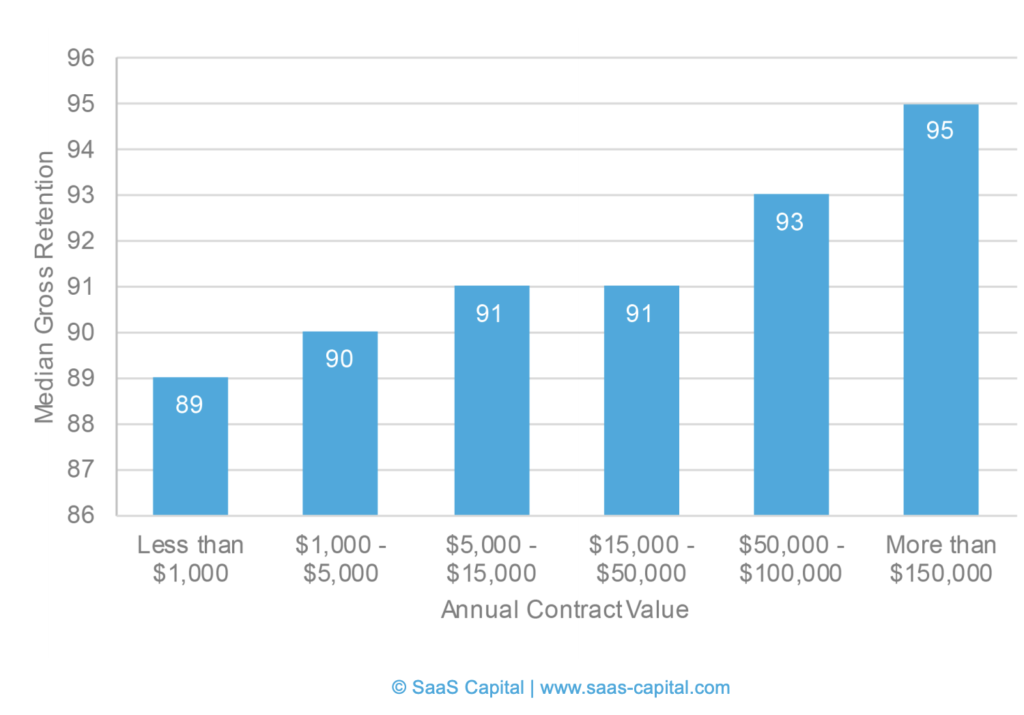
GRR benchmarks
This is slightly harder to find online, but I was able to find a great resource from https://www.saas-capital.com on GRR by annual contract value:
Interested in learning more about growth?
Enjoy!
Craig